
In this article
What is changing in the 2027 Medicare physician fee schedule?
The national conversion factor—the dollar multiplier used to calculate many physician payments—is scheduled to fall 2.31% for non-qualifying APM participants and 1.83% for qualifying participants in 2027. Part of the decline comes from the expiration of a temporary 2026 increase. Individual services can change by more or less as their relative values change. CMS final rule.
APM stands for Alternative Payment Model. These models connect payments to quality, spending or care coordination. Some still pay ordinary fee-for-service claims. Participating in an ACO does not automatically make a clinician a qualifying Advanced APM participant. CMS APM explanation.
Medicare reimbursement rates by specialty after practice costs
Here, purchasing power means what the practice’s reimbursement can buy: staff time, physician labor, supplies and other resources needed to deliver care. It does not refer to patients’ buying power or a physician’s take-home pay.
We priced the same mix of ten common office services in each year, then adjusted the fees for changes in national practice-input prices. Holding the service mix fixed lets us ask: does the money from the same work go as far toward practice costs?
The table shows the change from 2022. A result of −15% means the payment buys about 15% less of those practice resources. It does not mean the clinic’s total revenue or profit fell 15%.
| Same selected office services | 2022 to 2025 | 2022 to 2027 projected |
|---|---|---|
| Dermatology | −14.9% | −21.6% |
| ENT | −14.9% | −17.5% |
| Orthopedics | −14.3% | −16.8% |
| Primary care | −14.3% | −16.0% |
A simple $100 example
Scale our dermatology basket’s 2022 payment to $100. The same work pays about $95.42 in 2025. Meanwhile, the national practice-input price benchmark rises 12.2%.
That $95.42 therefore buys about $85.06 worth of 2022 practice inputs—a 14.9% reduction in what the payment can cover. These are scaled payment equivalents, not a claim that a real visit paid $100 or originally cost $100 to deliver.
Dermatology shows the largest projected decline among these office baskets. 2022 to 2025, however, all four had lost roughly 14–15% of purchasing power. These are selected national fee-schedule comparisons, not clinic revenue changes. New add-ons and claim-specific reductions are excluded from the baskets. CMS service volumes, fee files, 2027 values and practice-cost data.
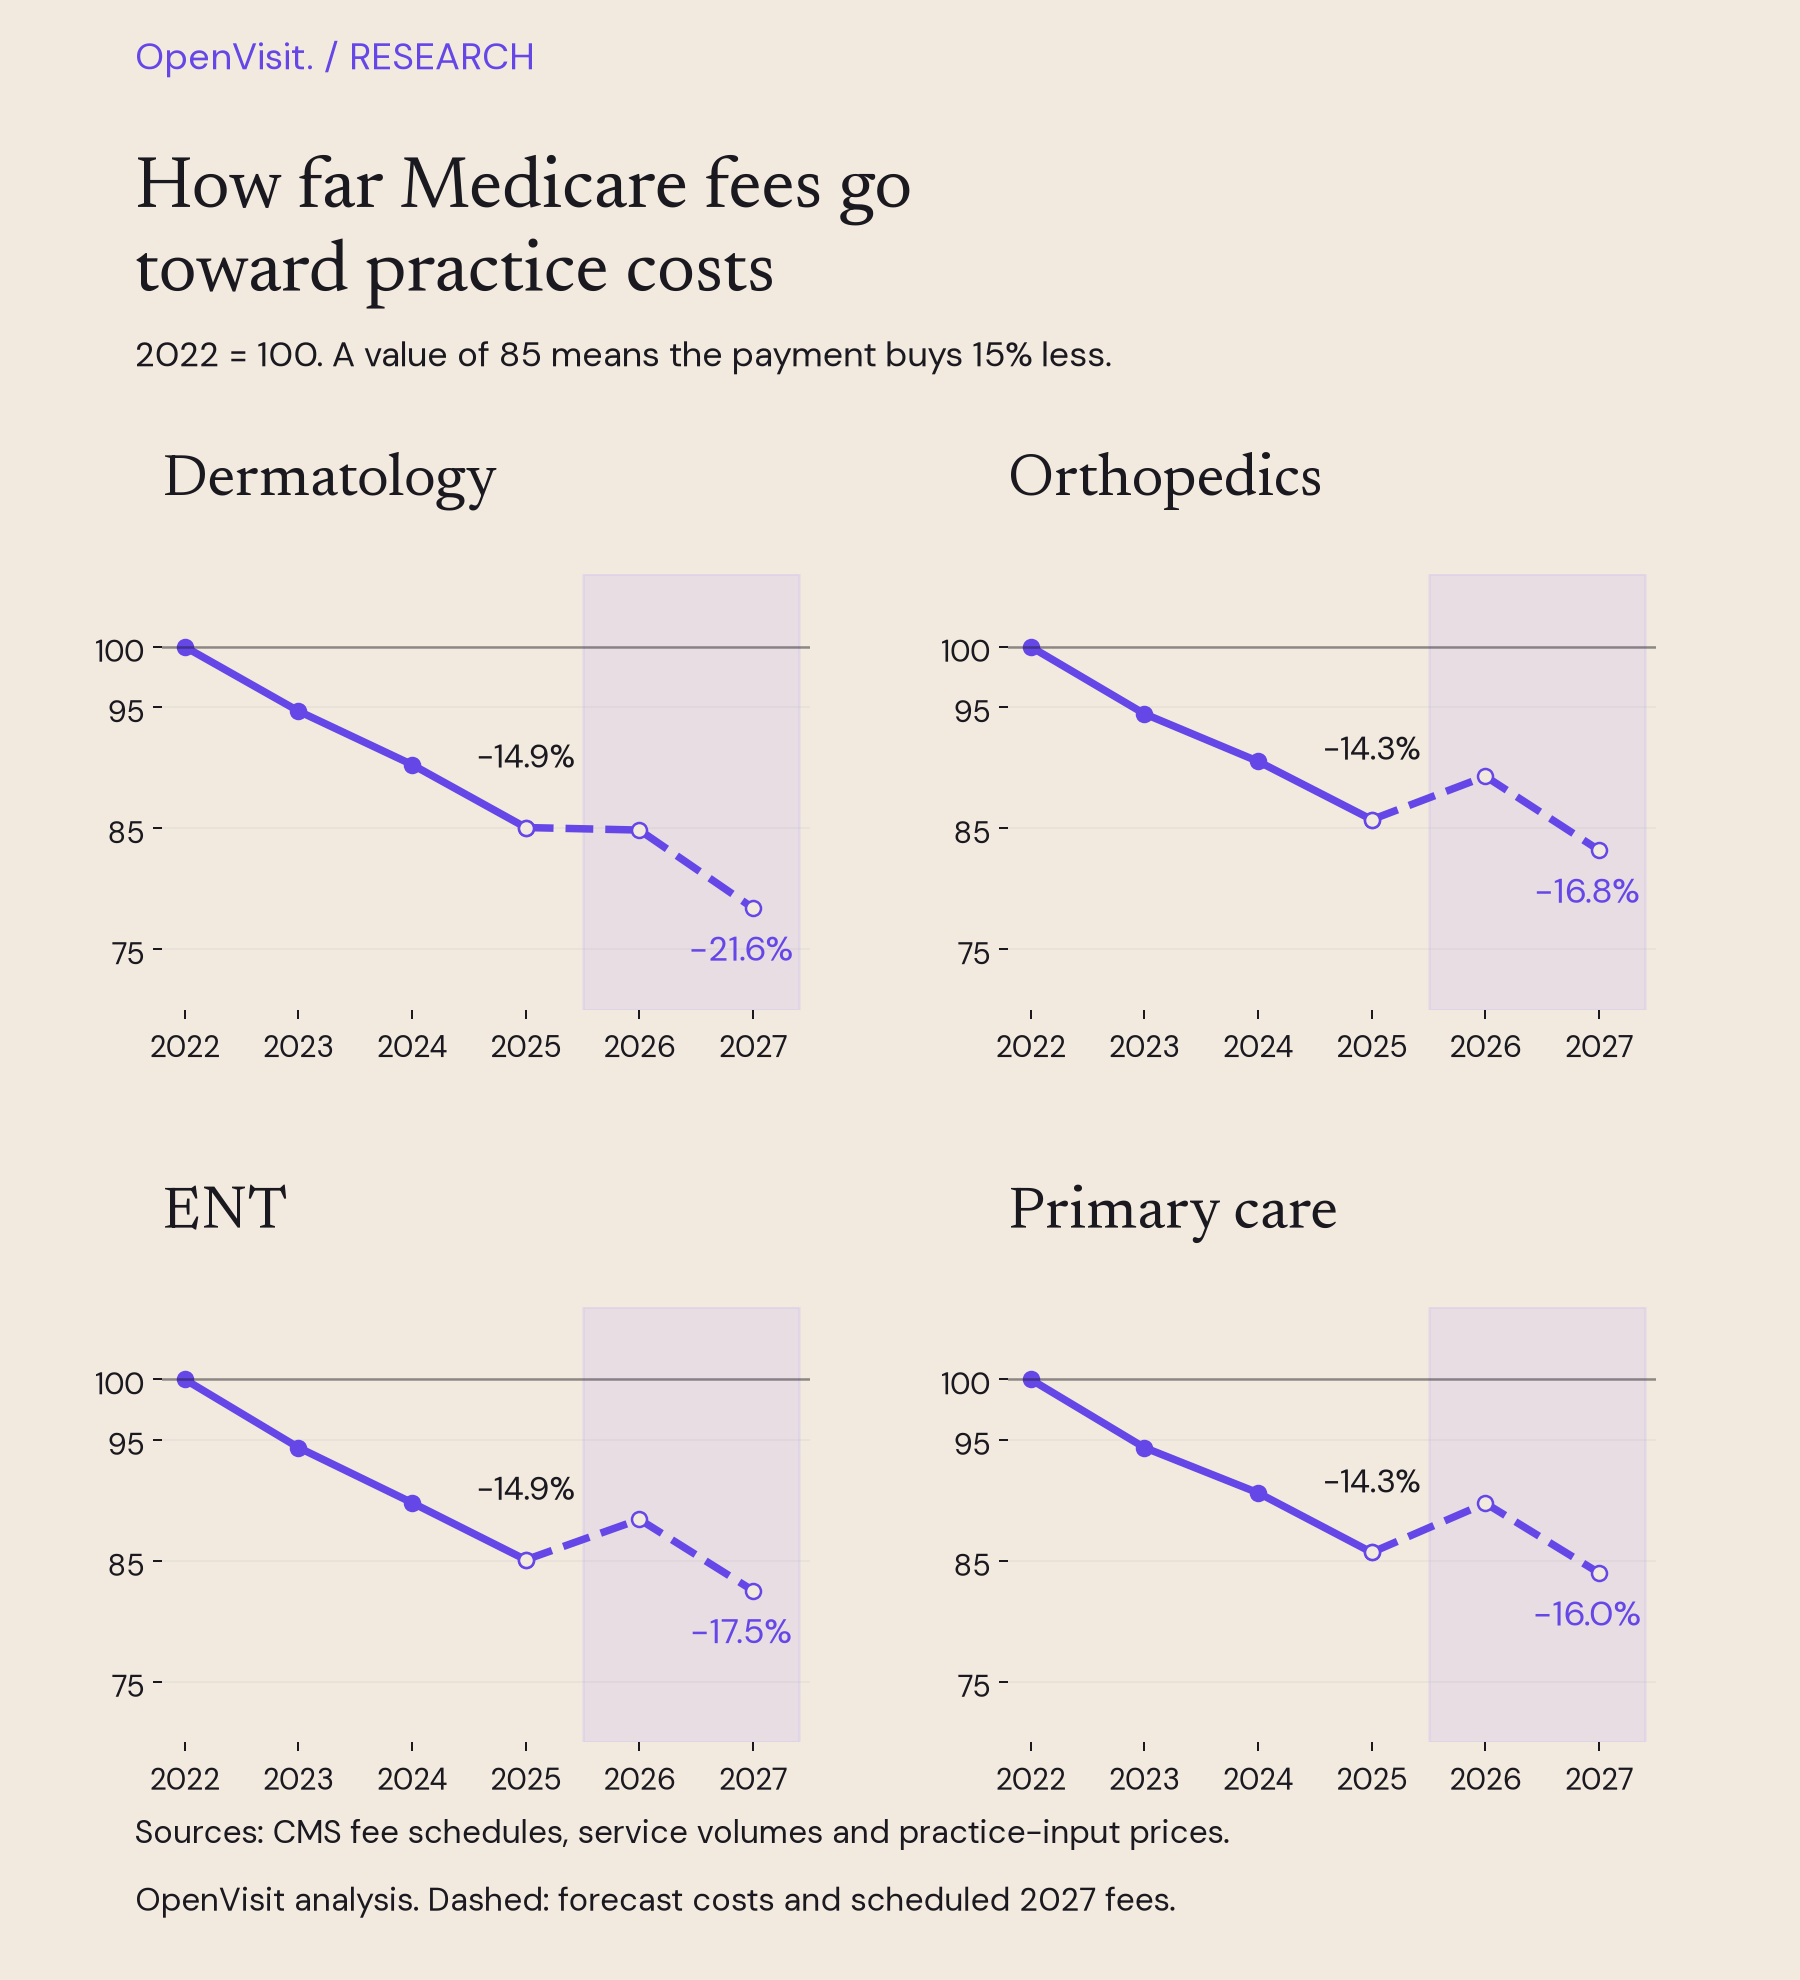
Costs for 2026 are partly forecast. The 2027 costs are entirely forecast, and its payment rates are scheduled. Methods and annual data are available below.
What the results could mean for your practice
If a practice delivers the same work with the same staffing, payments that lag behind input costs can put pressure on margins. Whether that changes appointment capacity or service offerings depends on the practice’s expenses, payer mix and other income. A clinic with relatively few Medicare patients has less direct exposure to these fee changes.
Dermatology: procedure-heavy clinics may feel more pressure than the office-visit average suggests. ENT: a practice’s mix of visits and procedures matters. Orthopedics: an office-only sports-medicine clinic has different exposure from a surgery-heavy practice. These service examples show why:
The figures below compare the same service and setting, rather than the whole specialty:
- Skin biopsy, office (11102): the national fee fell from $105.55 in 2022 to $95.75 in 2025, a 19.1% loss of purchasing power. The 2027 projection is −28.7%.
- Diagnostic laryngoscopy, office (31575): purchasing power fell 17.1% through 2025, with a −24.9% projection through 2027.
- Knee replacement, surgeon fee in a facility (27447): purchasing power fell 14.7% through 2025, with a −39.4% projection through 2027. That is the surgeon's professional fee and global package—not the hospital, anesthesia, implant or total surgery bill.
Sources: CMS historical rates, 2027 procedure comparison and practice-input prices. The projected figures do not describe observed 2027 payments or every practice's revenue.
Primary care add-on payments can narrow the gap
For primary care, the practical outlook can be better than the base-code comparison suggests: some qualifying longitudinal-care visits receive an additional payment. A base office-visit code does not tell the whole story. For a qualifying established visit, 99214 plus G2211 totals about $140.71 in 2025. After practice-cost inflation, that is 3.3% below the 2022 base visit, compared with a 14.0% decline for 99214 alone. This is a conditional per-visit example, not an assumption that every appointment qualifies. CMS rates and G2211 eligibility.
For 2027, CMS replaces G2211 with the B1 modifier, which increases qualifying E/M payments by 16%. A separate B2 modifier provides 32% for specified ACO participants. Eligibility and service mix are essential to any practice-level forecast. CMS final rule.
What reimbursement pressure means for cash-pay care
Lower insurance reimbursement may prompt practices to examine self-pay offerings. The useful starting point is a defined service with a sustainable price, clear inclusions and explicit exclusions.
Examples already exist in Texas. Chic Derm & Aesthetics in Allen publishes a $50 dermatology consultation and an $85 Accutane monitoring visit. Its OpenVisit care-team profile includes Faseeha Raza, MMS, PA-C. These are practice-published visit prices, not individually confirmed clinician fees; medication, labs and additional procedures are not established as included. Original price menu.
Magnolia Medical & Aesthetics in San Antonio illustrates pricing by visit complexity: $75 for a simple medical dermatology visit and $135 for a moderate visit, under the practice’s published eligibility criteria. Applicable add-on procedures, pathology, labs and outside prescriptions cost extra. These are different services, not comparisons with the Medicare fees above. Original price menu and inclusions.
Cash pay can still be fee for service: a patient pays for a visit instead of using insurance for that service. A subscription is a different offering and needs clear recurring charges, benefits and exclusions. Medicare-covered care has separate billing and private-contracting rules; a payment cut does not create blanket permission to replace covered claims with cash charges. CMS requirements.
For patients, the practical question is what a price buys and what might cost extra. Financial pressure could affect service availability, but it does not establish an access crisis: MedPAC's 2025 survey found Medicare beneficiaries generally reported better access than privately insured respondents. MedPAC findings.
For a patient-facing explanation of self-pay care, see our guide to seeing a dermatologist without insurance.
Your practice, clearly presented
Make your self-pay services easier to find.
Help patients understand your prices, visit details and care options before contacting your practice.
Explore OpenVisit for cliniciansSources and methodology
Every numerical comparison above links to its source data. Explore the full calculations without interrupting the article.
How we calculated the comparisons and selected services
How we compared Medicare payments with practice costs
We used CMS national, geographically unadjusted professional fee schedule amounts. For 2022–2026, quarterly RVUs and conversion factors are weighted by calendar days, including the March 9, 2024 revision. The 2027 calculation uses final addendum B and the non-QP conversion factor of $32.6286. These allowed amounts include the patient's share and precede claim-specific adjustments; they are not realized clinic receipts.
The baskets use 2025 PSPS office billing (place of service 11), specialty codes 07, 20, 04 and primary care codes 01/08/11/38. We select the ten most frequent codes payable across all six years, using numeric submitted units in unsuppressed cells with positive allowed charges and no error indicator. Professional-only and technical-only component rows are excluded. These baskets represent approximately 58–79% of observed eligible office allowed charges, depending on specialty. Submitted units are an observable frequency proxy; they are not a count of fully paid visits.
Costs use annual averages of the raw 2017-based Medicare Economic Index input-price levels, before productivity adjustment, from CMS's 2026Q2 release. Historical cost data extend through 2026Q1. The index includes physician labor and operating inputs; it is not specialty-specific overhead. Real change equals the fee ratio divided by the input-price ratio, minus one. New payment streams, changing volumes and changing payer mix are outside the base-basket comparison.
Primary data sources
- CMS quarterly physician fee schedule RVU files
- CMS 2027 final addenda and selected-procedure comparison
- CMS 2025 Physician/Supplier Procedure Summary
- CMS specialty-code definitions
- CMS market-basket data and vintage notes
- Direct practice-input price dataset
Download the calculations
AI tools assisted research and drafting. No independent clinical review is claimed. Source organizations have not endorsed OpenVisit or reviewed this article.